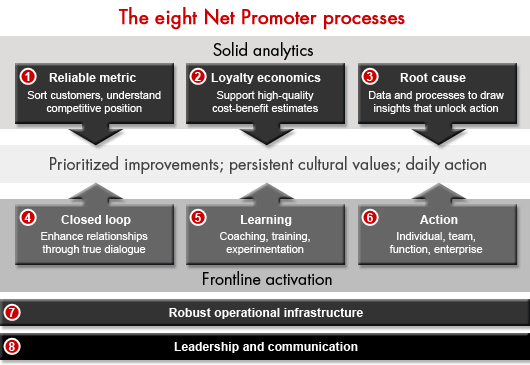
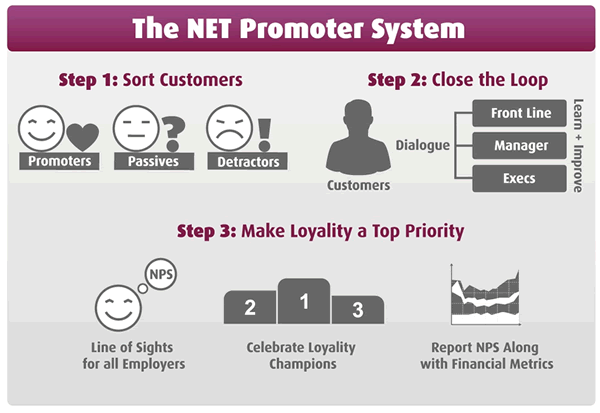
Customer experience management software vendor Satmetrix, one of the trademark holders of the Net Promoter Score, provides a nice overview of what it calls the Net Promoter journey in a graphical way. Let’s take a look at it to understand NPS as a process and system, with some additional considerations and visuals from other market players/sources (Resonate and Bain & Company).
To learn more about Net Promoter processes, also check out this page of the Net Promoter System (Bain & Company) whereby action, learning and the loop we’ll all mention below are explained in a nice overview and a visual way.
The first step, according to Satmetrix is to choose a score. The company looks at the three best-known scores: Customer Effort Score, CSAT (customer satisfaction) and of course “its own” NPS (Net Promoter Score), which it uses and explains in the infographic you find below.

In practice, many organizations use multiple customer experience scores and simple scores do have their inconveniences. In fact, there is no such thing as the perfect score. Furthermore, so called single-question customer metrics such as NPS and CES are pretty risky as the context matters and customer experience is far more than about a single question. It’s a complex given and, more important than the score is the insight and action.
Customer Effort system and process elements
Let’s say that NPS and CES are pretty well marketed by their “inventors” and that, in the end, NPS (nor CES for that matter) are not even really “inventions”. NPS is based on “willingness to recommend” and CES is based on thinking regarding lean and effort as such. Still, many organizations de facto use NPS (and increasingly CES and of course many still use CSAT) and those who succeed do it in a smart way, looking at the overall context and goals.
Fortunately Satmetrix focuses on the important steps and provides some good insights in the infographic. So, let’s move to the other steps in your “Net Promoter journey”:
Gather trustworthy data.
With a focus on prioritizing high-value segments as we typically do in customer-centricity, Satmetrix advises to amplify important voices to maximize profit with an example of how you can do it in B2B and B2C.
Collecting feedback happens in many ways, from in-person and the phone to online and mobile (the latter two promoted by Satmetrix as a vendor). Looking beyond NPS and in a broader customer experience management context there are more sources to collect data as you would, for instance, do in customer journey mapping.
Understand what drives your score.
This is essential in NPS and all customer experience metrics as mentioned. A number/score as such is meaningless and a lot depends on the context as we explained several times. You need to know why promoters recommend you and what creates detractors. But you also need to identify what influences the scores customers give, take the contextual impact into account and ask (customers) why they give a specific score.
Satmetrix advises to correlate satisfaction ratings to NPS, identifying the factors that drive loyalty and then knowing where you need to improve. Obviously knowing that isn’t enough. You also need to act in order to improve and, as the infographic indicates, prioritization is important here as well.

Improve individual customer loyalty.
This is where we meet the famous closed loop of the customer journey and of customer experience. A clear definition of this closed loop is important and is all about the link between customer feedback, analytics, internal processes, action as a way to respond to feedback, act upon insights extracted from data, ongoing optimization, continuous measurement etc.
Let’s say all the things you would also do in, for instance, marketing conversion and all business processes really, here in an individual context but as you’ll see next it also matters in a “holistic” context.

Improve overall customer experience and loyalty – ubiquitous optimization
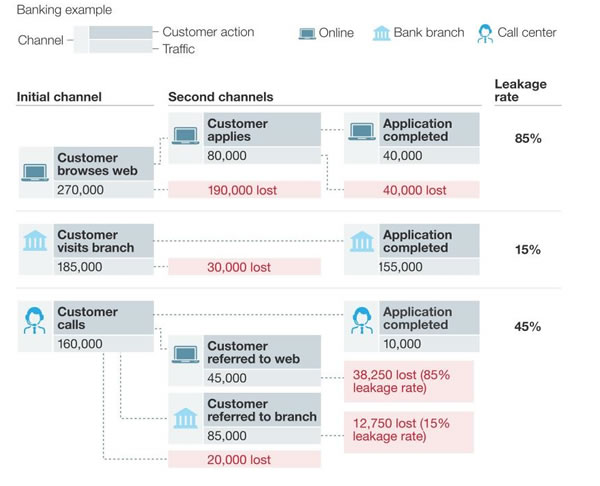
This is more or less what we just mentioned but then in a broader, structural context. Resources, processes, management, empowering frontline employees, it all plays a role. This is also what you would typically do in business process optimization, among others in a customer-facing context. Just think about how you can look at the impact of customer experience on leakage rates (image above), for example.
But, then again, in the end every business process impacts customer-facing processes. That’s what we call ubiquitous optimization: everything is connected, far beyond silos, functions and departments. Call it the butterfly effect.
Simply said in a few examples: if your IT team doesn’t invest in the right infrastructure, your website might be too slow and lead to poor user experiences and an increase of calls to your contact center etc. Or, if your back-office systems and processes aren’t streamlined and connected as they should, there will be a discrepancy between the efficiency of these crucial processes (take the processing of a loan request in a bank) and the front-end customers see and “experience” (such as using a tool to calculate the cost of a loan and then submit a request). If the latter is great and the back-office doesn’t work, the overall experience leads to bad customer experiences (also end-to-end) and increased leakage rates.
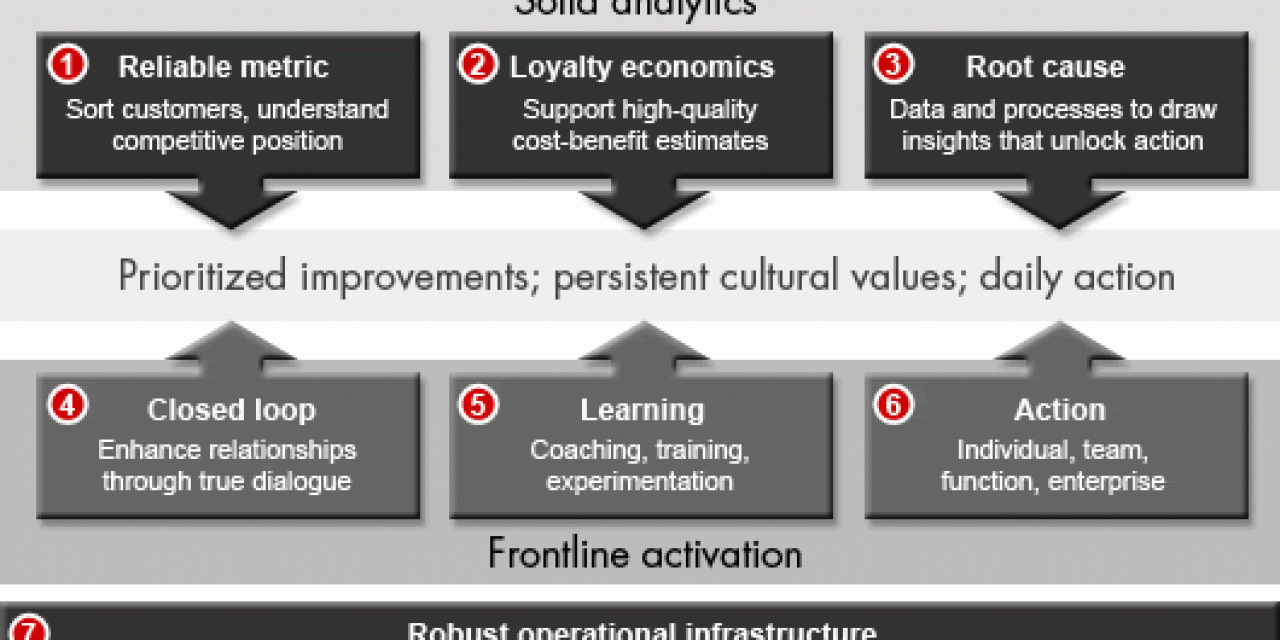
There are many more examples to explain this concept of ubiquitous optimization and the broader/structural context of customer experience but as we cover the NPS process here, take a look at the infographic below.

Net Promoter® and NPS® are registered trademarks and Net Promoter Score and Net Promoter System are trademarks of Bain & Company, Satmetrix Systems and Fred Reichheld.


